by:阮一峰

said, web development officers,Firebugis a Firefox browser plug-in one of the best .
my recent study on how to use Firebug, an on-line for beginners to find theDirectory, feeling more useful, on the translation out.
=================
Firebug Start Guide
Author: Estelle Weyl
the original site:http://www.evotech.net/blog/2007/06/introduction-to-firebug/
Translator: Ruan Yi-feng
This paper is an overview of Firebug, it is not all the characteristics of detailed explanation. However, the content of the paper on a rookie, should be sufficient.
directory
an installation Firebug
Second, open and close Firebug
3, Firebug window overview
Fourth, at any time editorial pages
5, with Firebug deal with CSS
6, box-shaped model
7, evaluation download speeds
8, DOM
9, Javascript debugging
10, AJAX
11, Note
an installation Firebug
Firebug in the Firefox browser to run. In addition, there are a Firebug lite version, you can call javascript, included in the page, so in other non-use of the Firefox browser. This paper is not involved in this version.
installed Firebug, please visitFirebug download page. Click on the right side of the page column of the huge orange yellow button. You can also Mozilla'sFireFox Add-onssite to download it. After the installation as long as the restart FireFox, you can use.
If you have already installed, so please check whether the update to the latest version. Firefox open the "Tools"menu, select "Add-ons"order, and then click on the pop-up window in the bottom left corner of the "Find Updates"button.
Second, open and close Firebug
in Firebug site, you can find itshortcut set. I most often use the following three ways:
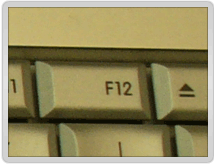
* Open Firebug: the F12, or click your browser's status bar the right of the
green signs.
* Close Firebug: the F12, or click your browser's status bar the right of the
green logo, or click on the upper right corner of the window Firebug
closed red signs.
* in a separate window open Firebug: click the window firebug upper right corner of the
Red Arrow logo, or use Ctrl+F12/⌘+F12 button.
Firebug the relevant settings:
Firebug* fixed in the new window opens: first open firebug, click on the upper left corner of the bug marks, select options in the menu "Always Open in New Window"settings.
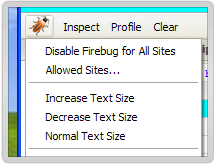
* increase/reduce the font size: you open the firebug, click on the upper left corner of the bug marks, select "Text Size"order. Changes in the rate of each character is very small, you may need to use repeatedly.
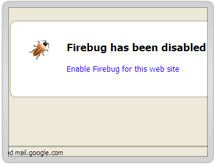
* restrictions apply only to certain sites use Firebug: first right-click your browser's status on the green check mark logo, choose "disable Firebug"order. Then, right-click Bianhui this has been the symbol of choice "Allowed Sites ..."orders, an increase Firebug allow the entry into force of the domain name.
3, Firebug window Survey
* Console tab: The main use of javascript command-line operation, show that javascript error in the bottom of the>>>prompt, you can type in their orders javascript.
* HTML tags: display HTML source code, and like the DOM hierarchy, each line before indentation. You can choose to show or not show that a child nodes.
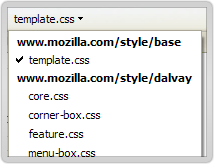
* CSS tab: View all has been put into the style sheet, you can modify the spot. Firebug window in the upper part, "edit"the next order, one of the pages in all stylesheet the drop-down list, you can choose a style sheet browse.
* Script tab: javascript document and its display of pages. Firebug window in the upper part, "inspect"the next order, there is a Javascript all of the pages in the drop-down list of documents, you can choose a browse. You can order javascript, set breakpoints (breakpoint) and the conditions.
* DOM label: All the pages objects and objects of the attributes window. In javascript, all the variables are the attributes window objects, Firebug will display all the variables and their values.
* Net label: This page shows all the download, and they spend their time, their first request for information and HTTP server response to the first information. XHR labels on debugging AJAX useful.
40, at any time editorial pages
in HTML tab, click the window at the top of the "inspect"command and then select pages of text nodes, you can modify and amend the results will be immediately reflected in the pages.
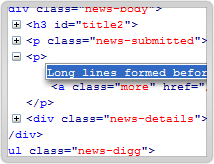
Firebug is also the source browser and editor. All HTML, CSS and Javascript objects in the document, are able to click or double-click to edit. When you enter completed, the browser pages corresponding changes will happen immediately, you can get instant feedback. DOM browser allows you to a document structure to conduct a thorough editing, not limited to the text nodes. In HTML tab, click on the upper window "inspect"an order next to the "edit"command, the bottom of the window will immediately become a black and white text editor window, you can carry out arbitrary HTML source code editor. In CSS tab, Firebug will automatically fill all of your input. In DOM tab, when you press the Tab key time, Firebug will automatically fill the entire property name.
5, with Firebug deal with CSS
in DOM labels, each HTML element of style reveals the attributes of all the elements of CSS settings. You can double-click on the settings for editing.
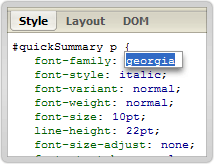
Firefox
For those who do not support the CSS rules, Firebug will automatically hide. For example, Firebug will be hidden for certain browser CSS specific settings, and some it did not support the CSS3 rules. Therefore, it will hide _ height: 25px; (underscore is a setup for IE6) and p: first-of-type (color:#ff0000;) (: first-of-type is a CSS3 provisions of the pseudo-class At present, only Safari 3 support). However, this also means that if you happen to a typographical error occurred, resulting in some of the rules can not be displayed, then you only use other editor show all CSS, you find a mistake.
Firebug CSS allows you to shut down some of the statements, the page will immediately reflect the corresponding change, you can immediately see results. "Close"is an expression of, in the words of the left-click, there will be a red![]() ban signs. The statement will Bianhui. Click again, the statement will be resumed.
ban signs. The statement will Bianhui. Click again, the statement will be resumed.
Firebug allows you to edit the CSS properties and property values. As long as you click on them, we can edit. The revised results will be immediately in the browser window display. This feature the best use is to determine the precise location of the padding and margin when, firebug allows you to use key-by-unit increase.
Firebug allows you to add new properties and property values. Double-click method is to increase the existing selector, then there will be a blank attributes of the input box, will appear after the completion of the importation of an empty property values.
6, box-shaped model
When you
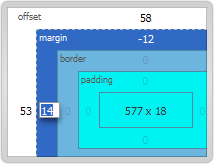
in HTML tab, click on an element, the left side of the window display HTML code, the right window showed that the elements of the CSS. CSS at the top of the window, a button layout, click will be displayed with the relevant elements of the box model, including padding, margin and border value. To view each of these three elements of value, just click the "inspect"button, and then use the mouse to hover in the pages of the elements in the top.
7 to assess the download speeds
Net tab graphical pages of all the http request of the time spent. Use this feature, we must open the Network monitoring, the default setting is open, but you can "options"drop-down menu to close this option. You can use this feature to assess javascript file downloads, using the entire page displays the time.
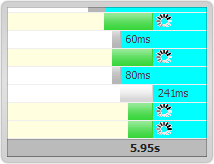
in each HTTP request to the left click, will show that the first request for information.
After
in version 1.0.5, you can see separate HTML files, CSS files, images and other files downloaded each time.
8, DOM
DOM label all the objects on the page to provide all the attributes of the information. Firebug one of the coolest features is that it can be modified dynamic pages, reflected in the browser window, but if you use the browser's built-in Show source function, you will find that the source has not changed.
9, Javascript debugging
JavaScript profiler can report your Javascript function implementation of the time spent, so you can see different functions of the impact speed. Use this feature method is to open the console tab, then click on the Profile button above (the order is the top button "Inspect | Clear | Profile"). Firebug call list all the functions, and the time spent. You may want to test for a certain function, in its front with console.profile ([title]), the Ministry added in subsequent console.profileEnd ().
console at the bottom of the label is a command line input, it">>>"to begin with. If the command line, the outcome of output, it will be displayed in the upper part of the window. A detailedcommand line, APIworthwhile to look at. Firebug built-in console object of a number of useful methods for the call, including console.debug, console.info, console.warning, console.error, etc.. If these methods produced output, Firebug would provide a link that allows you to see the corresponding code.
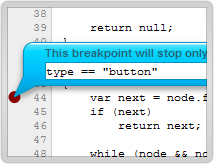
debugging Another way is to set up breakpoint. Script tab allows you to suspend the implementation of the arbitrary line. Click Bank, will set up a breakpoint. Right-click the line, can set a breakpoint on the condition that only when the conditions are true, the procedure will be suspended. There is also a watch right window, you can view the current variable value.
10, AJAX
already mentioned, Firebug can capture pages of dynamic content and other DOM changes. If you open thissample file, click on the link, in your browser View the source, you will find what has not changed, the source of that still contains links. But if you view the source code in Firebug, you will find that DOM has changed, "Hello World"has been included in the. Firebug This is one of the core functions, it does not, AJAX response to the request and is not visible. With it, you can see out of and received by the text, has been corresponding header. In Net tab, you can monitor every request/response to spend their time.
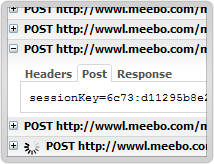
Net tab of XHR function, the view AJAX operation particularly useful. If you click on each server-side response to the pre-plus, you will see server-side response to the first information and content.
When
through XMLHttpRequest object to the server to send a request, Firebug records request POST or GET content, and to respond to the first information and content. Net label use of XHR function, we can see that these elements. It will list all the server's response, and the time it takes. Click on the+sign in front, if it is GET request, the three labels will show if the POST request, will display four labels:
Params: Showing the request contained in the URL of name/value right.
Headers: shows that the first request and respond to information.
Response: show the actual information received from the server.
Post: Showing through POST request, the information sent to the server. (The GET request does not include.)
four labels on writing and debugging process very useful. POST Params checks and labels, identify your request was correctly issued. See Response to return to check the label format to determine the appropriate Javascript function should deal with how to prepare.
11, Note
* Firebug 1.05 and the previous version, is not compatible with Firefox 3.0.
* Firebug Joe Hewitt, author of the software provided free of charge, to show that we love him, you can consider himDonors.
* Firebug some advanced applications, see Joe Hewitt of thisvideo presentation.
(End)
original link:http://www.ruanyifeng.com/blog/2008/06/firebug_tutorial.html
1 comment:
Hi there, thanks for descriptive Firebug tutorial.
Post a Comment